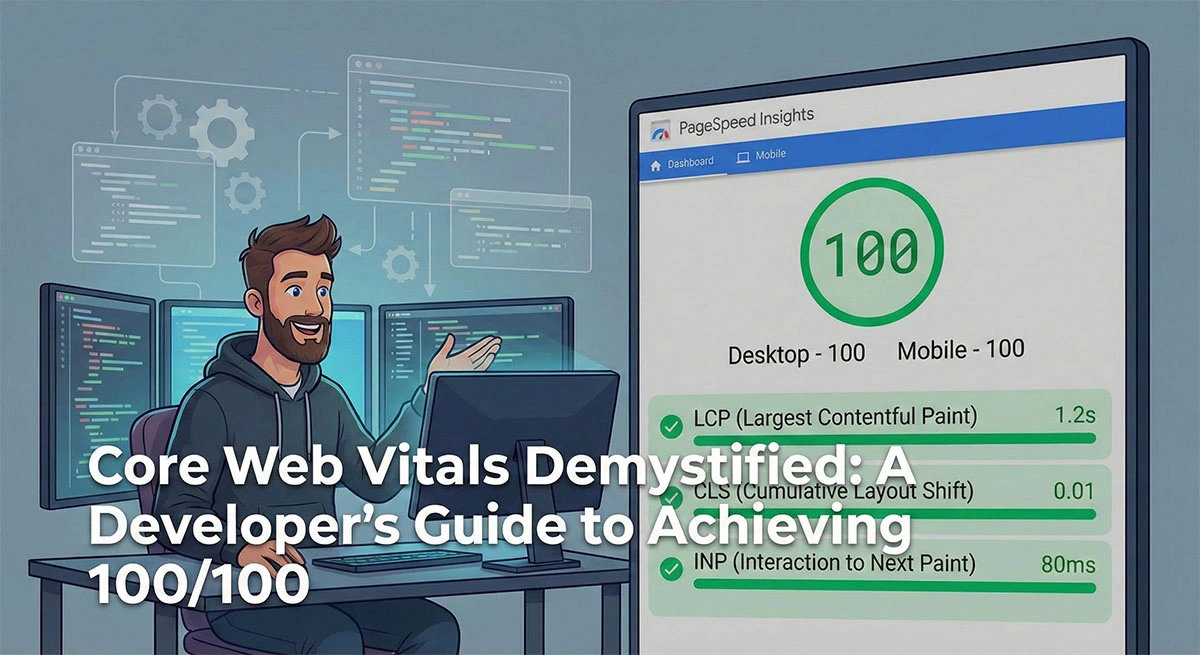
Core Web Vitals Demystified
Let’s be honest. If you’ve been a web developer for more than a week, you’ve probably had a client, a project manager, or an overzealous SEO consultant drop a Google PageSpeed Insights (PSI) report on your desk.
Usually, it's highlighted in angry red warning colors, demanding to know why the website is "failing" Google’s tests.
Years ago, we could just brush this off. We’d minify some CSS, defer a couple of scripts, install a caching plugin, and call it a day. But in 2026, Google's Core Web Vitals (CWV) are a non-negotiable ranking factor. More importantly, they actually represent real user experience. A site that scores 100/100 isn't just appeasing the Googlebot—it feels snappy, stable, and professional to human users.
Getting to that perfect 100/100 isn't about installing a magic plugin. It requires fundamentally understanding how the browser renders your code. Let’s break down the "Big Three" metrics and how we, as developers, can actually fix them.
The Big Three: What We Are Actually Measuring
Google currently focuses on three core metrics. (If you're still thinking about First Input Delay or FID, it's time to update your knowledge base—Google fully replaced FID with INP a couple of years ago).
-
LCP (Largest Contentful Paint): Loading performance.
-
CLS (Cumulative Layout Shift): Visual stability.
-
INP (Interaction to Next Paint): Responsiveness to user input.
Let’s tackle them one by one.
1. Fixing LCP (Largest Contentful Paint)
The Goal: Less than 2.5 seconds.
LCP measures how long it takes for the largest element in the viewport (usually a hero image, a video poster, or a massive <h1> block) to render. If your LCP is slow, your users are staring at a blank screen.
How Developers Fix LCP:
-
Fix Your TTFB First: Time to First Byte is step one. If your server takes 1.5 seconds to query the database and generate the HTML (I'm looking at you, unoptimized WordPress themes and heavy Laravel Eloquent queries), you only have 1 second left to download assets and render the page. Use server-side caching (Redis, Memcached) and a solid CDN.
-
Prioritize the Hero Element: The browser needs to know your hero image is important. Add
fetchpriority="high"to your LCP image so the browser downloads it immediately, ahead of other lower-priority assets. -
Modern Image Formats: Stop serving massive JPEGs or PNGs. Serve WebP or, better yet, AVIF.
-
Preconnect to Critical Origins: If your LCP element relies on a third-party domain (like an external font or a CDN), use
<link rel="preconnect" href="...">in the<head>to establish the connection early. -
Inline Critical CSS: Render-blocking CSS is an LCP killer. Extract the CSS required to style the "above the fold" content and inline it directly into the
<head>. Defer the rest of the stylesheet.
2. Fixing CLS (Cumulative Layout Shift)
The Goal: Less than 0.1.
CLS measures layout jank. You know the feeling: you're reading an article on your phone, you go to tap a button, and suddenly an ad loads in, pushing the text down, and you accidentally click on a scammy banner. That's a layout shift, and Google penalizes it heavily.
How Developers Fix CLS:
-
Always Declare Width and Height: This is HTML 101, but we all forget it. Every
<img>,<video>, and<iframe>must have explicitwidthandheightattributes. This tells the browser exactly how much space to reserve in the DOM before the asset even downloads.

-
Reserve Space for Ads and Injected Content: If you have an ad slot or a dynamic widget that loads via JavaScript, wrap it in a container div with a CSS
min-height. That way, the space is held, and when the content finally injects, nothing gets pushed down. -
Handle Web Fonts Carefully: When a custom font loads, it often swaps out the fallback font, which has different sizing. This causes a shift (FOUT/FOIT). Use
font-display: swapin your@font-facedeclaration, and look into CSSsize-adjustproperties to match your fallback font's dimensions to your custom web font.
3. Fixing INP (Interaction to Next Paint)
The Goal: Less than 200 milliseconds.
This is the hardest metric for most front-end developers to swallow. INP measures how quickly your app responds to a user clicking, tapping, or typing. If your site feels "frozen" or laggy when a user interacts with it, your INP is failing.
Why does it freeze? Because the browser's Main Thread is blocked. JavaScript is single-threaded. If you fire off a massive, complex JS function that takes 500ms to execute, the browser cannot paint any visual updates to the screen until that function finishes.
How Developers Fix INP:
-
Break Up Long Tasks (Yield to the Main Thread): If you have a heavy JavaScript operation, don't run it all at once. Break it up using
setTimeout, or use modern APIs likescheduler.yield()to pause your code, let the browser render user interactions, and then resume the script. -
Code Splitting: Don't send a massive
bundle.jsfile to the browser. If a user is on the homepage, they don't need the JavaScript that powers your checkout form. Use Webpack, Vite, or your framework of choice to split your code into smaller chunks. -
Reduce DOM Size: A massive, deeply nested HTML structure takes longer for the browser to recalculate when JavaScript makes a change. Keep your DOM shallow and clean. If you are rendering a list of 5,000 items, use a virtualized list so only the visible items are in the DOM.
-
Debounce and Throttle Event Listeners: If you have scroll or resize event listeners firing complex calculations on every single pixel movement, you will destroy your INP. Debounce those functions.
Lab Data vs. Field Data: The Final Reality Check
As a final note, remember that getting 100/100 on PageSpeed Insights (which uses Lighthouse to generate Lab Data) is great, but it's not the ultimate source of truth.
Google actually ranks your site based on Field Data (from the Chrome User Experience Report, or CrUX). This is real-world data collected from actual Chrome users visiting your site on their actual devices and network connections. You can't fake CrUX data.
If your lab data says 100 but your field data is failing, it means your users are likely on slower devices or 3G networks than your test environment simulates. Optimize for the worst-case scenario.
Achieving perfect Core Web Vitals isn't a dark art. It's just a commitment to clean architecture, lightweight code, and respecting the browser's rendering path.
